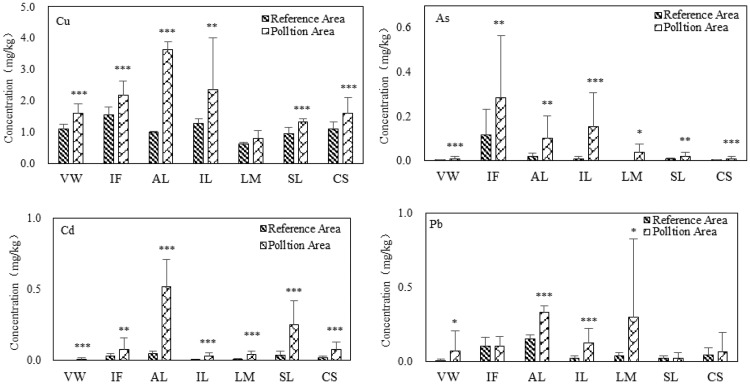
Figure 2.
Heavy metal concentrations in the edible parts of vegetables. The error bars indicate the standard deviation, and the asterisks indicate significant differences in heavy metal concentrations between vegetable grown in mine-affected and reference soils. *P < 0.1, **P < 0.05, and ***P < 0.001.

