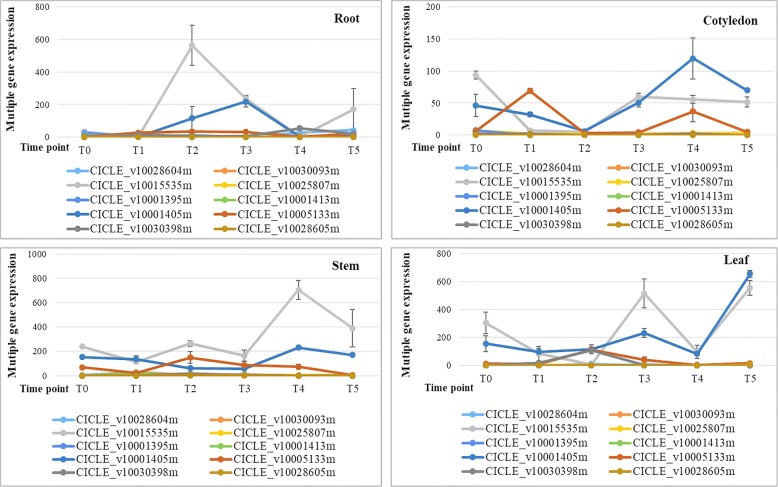
Fig. 2.
Differential expression patterns of the 10 CHS candidates in young seedlings with or without the MeJA treatment
The ordinate Y is the relative expression level based on the 2^(−△△Ct) method. The X-axis shows the time points for the MeJA treatment. T0 is the control with distilled water. T1 (12 h) is 12 h after MeJA treatment (same convention for T2 (24 h), T3 (36 h), T4 (48 h), and T5 (60 h))

