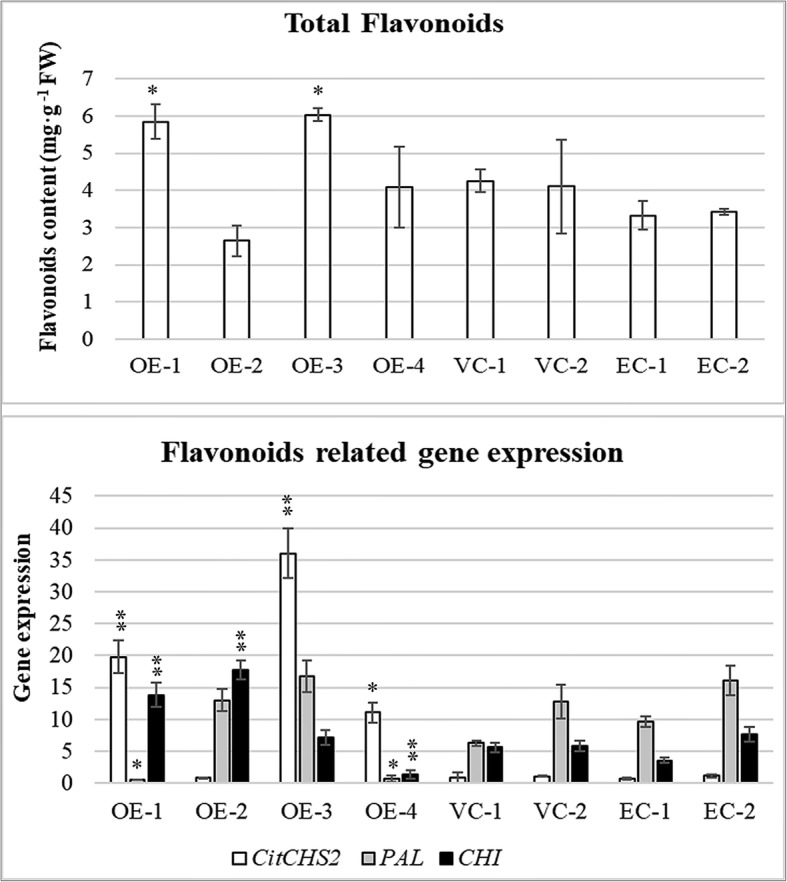
Fig. 6.

Flavonoid content and expression level of flavonoid production-related genes in over-expression plants **
VC-1 and VC-2 are vector-only control plants. EC-1 and EC-2 are healthy control plants, wild type. OE-1, OE-2, OE-3 and OE-4 are positive over-expression plants. Significant differences with the control (all controls) are indicated: * < 0.05; < 0.01
