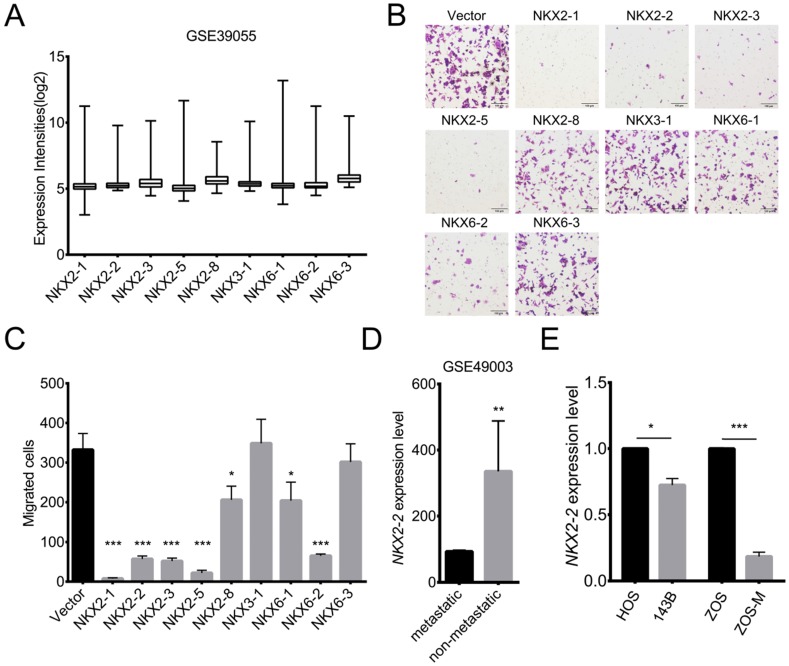
Figure 1.
The results of the migration assay reveal multiple NXK genes, including NKX2-2, that inhibit migration. (A) Expression levels of NKX genes in osteosarcoma biopsy specimens (GSE39055: n=37). Values are presented as medians ± relative deviations. (B, C) The migration of 143B cells transduced with the indicated NKX genes was determined as described in the “Methods”. Representative images (100×) of the indicated stably transfected cell lines are shown (B). n = 5 fields per replicate; 3 replicates per condition, data are representative of three independent experiments (C). (D) Expression level of NKX2-2 in metastatic and non-metastatic osteosarcoma cell lines (GSE49003). (E) Real-time qPCR of NKX2-2 expression in osteosarcoma cells. The graph of the qPCR data shows average relative expression normalized to GAPDH. Data are representative of two independent experiments. Data are presented as the means ± SDs. Two-tailed unpaired t test: *P < 0.05, **P < 0.01 and ***P < 0.001.

