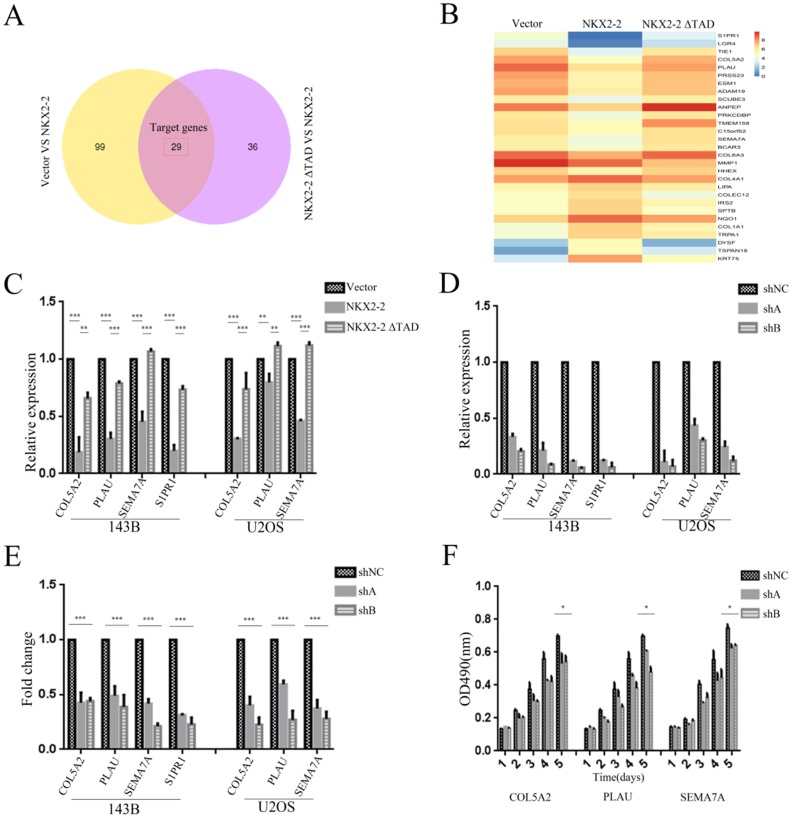
Figure 5.
Identification of the downstream effectors of NKX2-2 that mediates its tumor suppressive function. (A) The differentially expressed genes between the vector and NKX2-2 groups (left circle) and between the NKX2-2 ΔTAD and NKX2-2 groups (right circle) are displayed in a Venn diagram. The shared parts of two circles represented the target genes. (B) Gene expression profiles of target genes. Values are presented as log2 (fold changes). (C) Real-time qPCR analysis of COL5A2, PLAU, SEMA7A and S1PR1 expression in osteosarcoma cells transduced with the vector control, NKX2-2 or NKX2-2 ΔTAD. The graph of the qPCR data shows the average relative expression normalized to GAPDH from three replicates per condition. Data are representative of two independent experiments. (D) COL5A2, PLAU, SEMA7A and S1PR1 levels in osteosarcoma cells stably expressing shRNAs (shA and shB) were assessed by real-time qPCR as described in (C). (E) The migration of osteosarcoma cells transduced with the indicated shA, shB or shNC construct was determined as described in the “Methods”. n = 5 fields per replicate; 3 replicates per condition; data are representative of three independent experiments. (F) The proliferation of shA-, shB- or shNC-transduced U2OS was measured using MTT assays. The OD490 value was measured on the indicated day (error bars, SD; *P < 0.05; **P < 0.01; ***P < 0.001).

