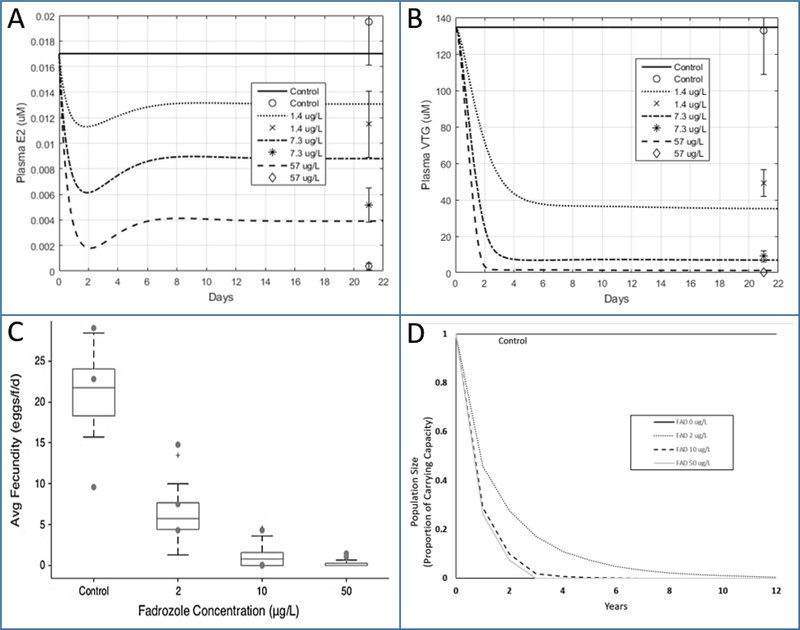
Figure 2.
Fadrozole 21 day, continuous exposure study. HPG axis model (9) predictions after 21 days of continuous exposure to fadrozole at concentrations of 0, 1.4, 7.3, and 57 μg/L (41). The time sequence data are plotted for plasma E2 (A) and plasma VTG (B). Boxplots of averaged fecundity (12) are plotted against fadrozole concentration (C). Fathead minnow population size (14) resulting from exposure to fadrozole in comparison to control (D). Data in Figs. 2A and2B are shown as mean ± SEM.

