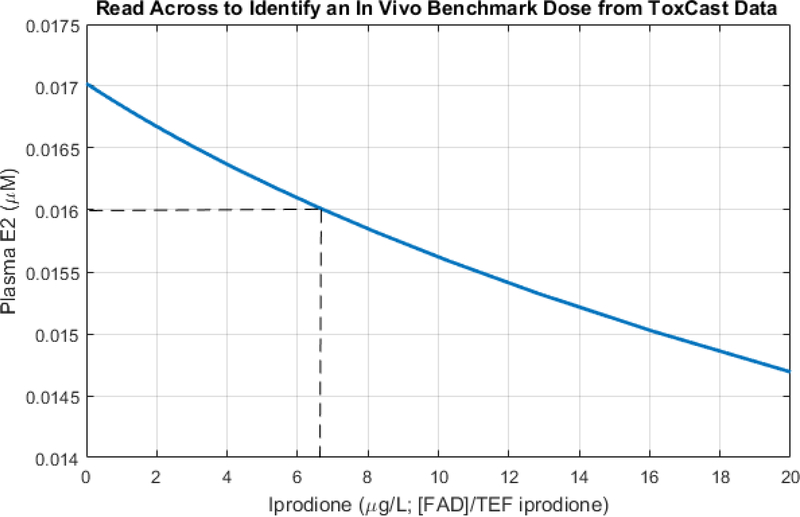
Figure 5.
Use of the qAOP (9, 12, 14) to semi-quantitatively predict a BMD for iprodione. A 20% decrease in fathead minnow population was considered to be a possible endpoint of regulatory interest. Read across (Fig. 4) of the qAOP was then used to identify a predicted plasma E2, continuous exposure to iprodione, as fadrozole equivalents, to identify a BMD assoicated with the 20% population decline (0.016 μM). The current plot, obtained with the HPG axis model, indicates that this level of plasma E2 is associcated with a continuous exposure to iprodione of between 6 and 7 μg/L.

