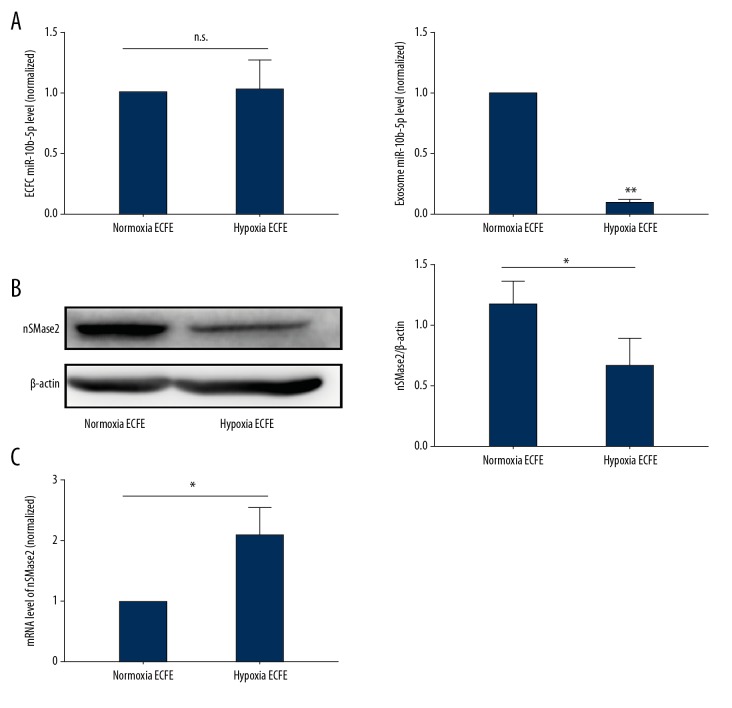
Figure 5.
Expression of N-Smase2 in hypoxia-treated ECFCs. ECFCs were incubated in a hypoxia chamber for 72 h, and miR-10b-5p levels in cells and hyp-exo were examined using PCR (A). N-SMase2 expression of normoxic and hypoxic ECFCs was detected by WB (B), and mRNA levels were also determined (C). Mean ±SD, n=3, by t test (A, B), ANOVA followed by Tukey’s post-test (C). * P<0.05; ** P<0.01

