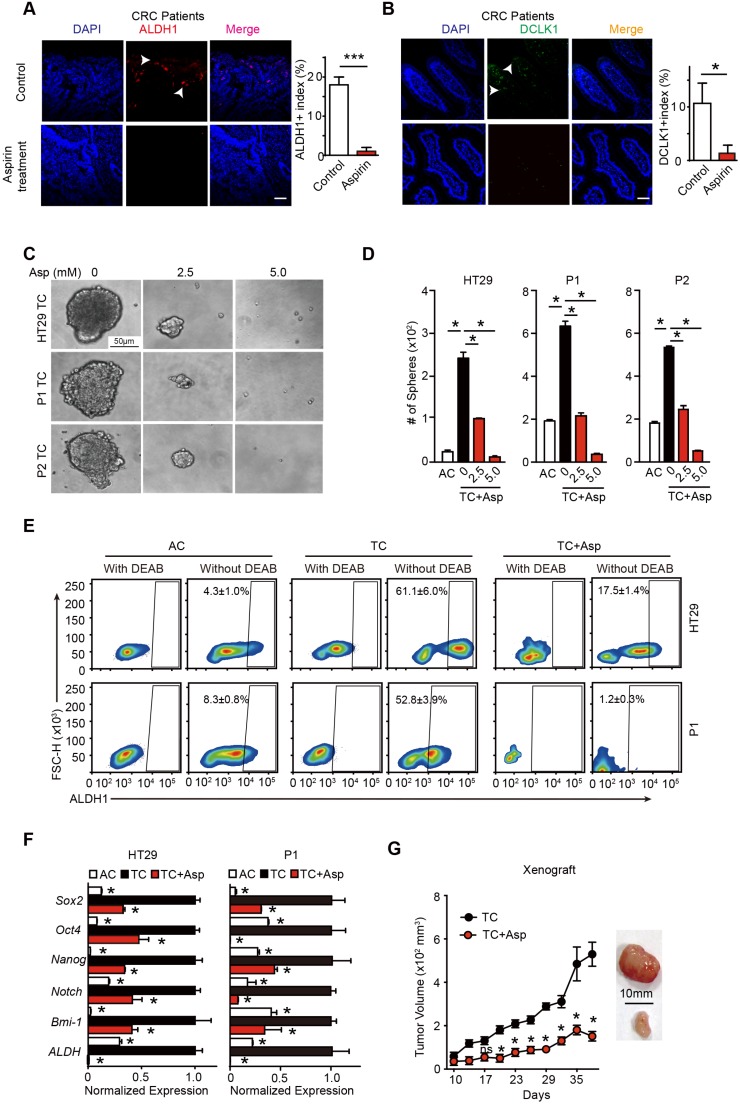
Figure 1.
Aspirin treatment eliminates colorectal CSCs. (A-B) Representative images (left) and quantification (right) of immunostaining assays used to detect the percentage of colorectal CSCs (ALDH1+, DLCK1+) in tumor cells in the paraffin specimens of patients. Scale bar indicates 100 μm. CRC: colorectal cancer. The results are presented as the mean ± SEM, n=3. *, p<0.01, unpaired t-test. (C-D) Tumorsphere-forming assay. Representative images (E) and quantification (F) of TCs (tumor spheres) formed from three colorectal cancer cell lines (HT29, P1, or P2) following 14-day treatment with aspirin (Asp) at the indicated concentrations. Tumor spheres formed from the adherent cells (ACs) of each cell line were also included. The results are presented as the mean ± SEM, n=3. *, p<0.01, one-way ANOVA. (E) The activity of ALDH1 analyzed using the ALDEFLUOR assay; diethylaminobenzaldehyde (DEAB) is a negative control, which was used to inhibit the reaction of ALDH with the ALDEFLUOR reagent. ALDH1-positive cells and their average percentages in the total cell counts are indicated in each panel (mean ± SEM, n=3). (F) Quantitative PCR (qPCR) results from HT29 and P1 ACs, TCs, or TCs with 2-day Asp treatment (5 mM) (mean ±SEM, n=3, normalized to Gapdh mRNA expression). *, p<0.01, one-way ANOVA compared to TCs without Asp treatment. (G) Tumor growth curve from xenograft assays following subcutaneous injection of 1×10⁵ TCs of HT29 cells into 6-week-old female nude mice (mean ± SEM, n=6). In vivo effects of Asp analyzed by i.p. injection of 20 mg/kg Asp following the seeding of TCs. *, p<0.01, two-way ANOVA compared to untreated TCs at the indicated time points. (See also Figure S1, Table S1 and Table S2)

