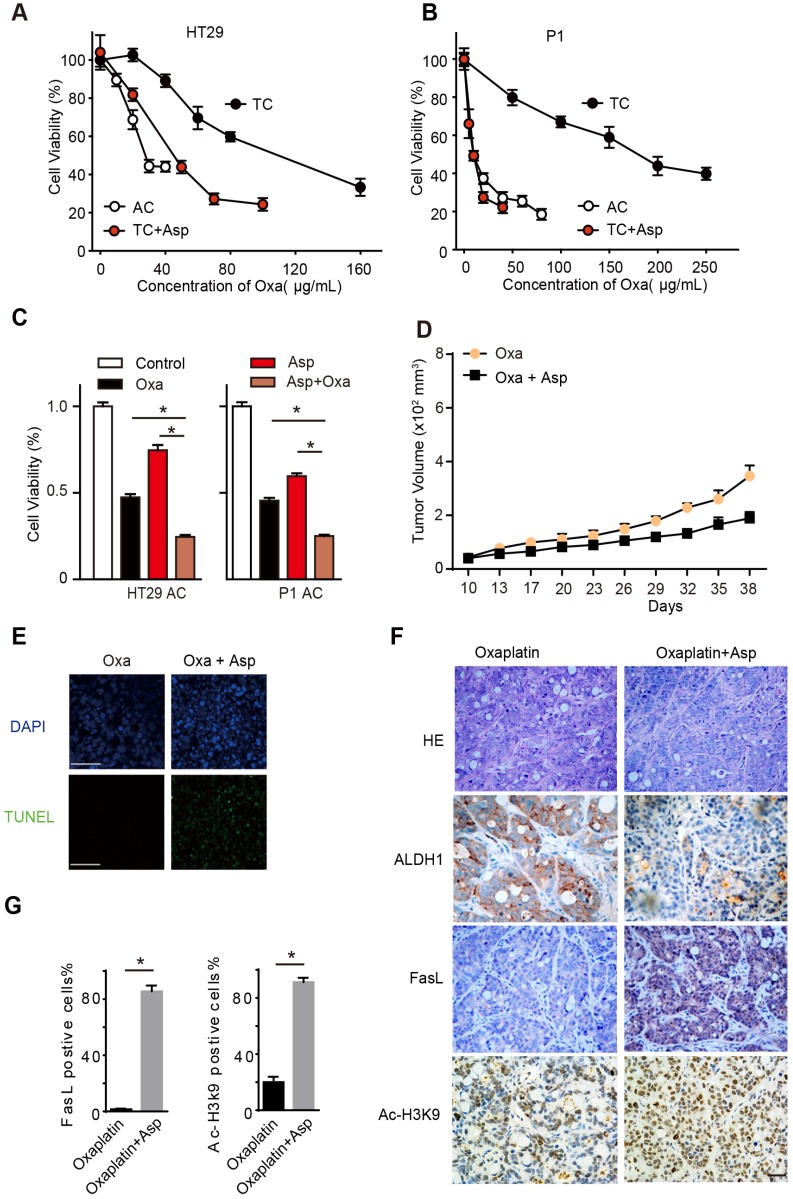
Figure 7.
Aspirin suppresses oxaliplatin-enriched CSCs. (A-B) Proliferation analysis of the survival of cells following 48 h exposure to Oxa at the indicated concentrations. The results of ACs, TCs, or TCs with Asp and Oxa co-treatment (5 mM) from the HT29 (A) or P1 (B) cell lines are presented (mean ±SEM, n=3). (C) Proliferation analysis of the survived cells following 48 h treatment with saline (Control group), Oxa (20 μg/mL), Asp (5 mM), or both Oxa and Asp. ACs from both HT29 and P1 cell lines were used. The data are presented as the mean ±SEM. * p<0.01, one-way ANOVA. (D) Tumor growth curve from xenograft assays following subcutaneous injection of 1×10⁵ HT29 TCs into 6-week-old female nude mice. The data are presented as the mean ± SEM and n=6 for each group. In vivo effects of Asp were analyzed by i.p. injection of both Asp (daily, 20 mg/kg body weight) and Oxa (once a week, 2 mg/kg/body weight) 10 days after seeding of TCs. The data are presented as the mean ± SEM. *, p<0.01 two-way ANOVA. (E) Representative images of TUNEL assays for detecting apoptotic cells from tumor tissues derived from HT29 TCs after Oxa treatment or both Oxa and Asp co-treatment. Scale bar indicates 20 μm. (F) Representative results of H&E staining and immunohistochemistry against ALDH1, FasL and ac-H3K9 on xenograft tumor sections from HT29 TCs mice treated with Oxa (once a week, 2 mg/kg/body weight) or Oxa combined with Asp (20 mg/kg body weight). Scale bar indicates 50 μm. (G) Quantification of immunohistochemistry on FasL or Ac-H3K9 positive cells in the tumors. Five visual fields were randomly selected and 100 cells in each visual field were counted. Data are shown as the percentage of the total number of positive cells. Values are presented as means ± SD, n=4. *P<0.05.

