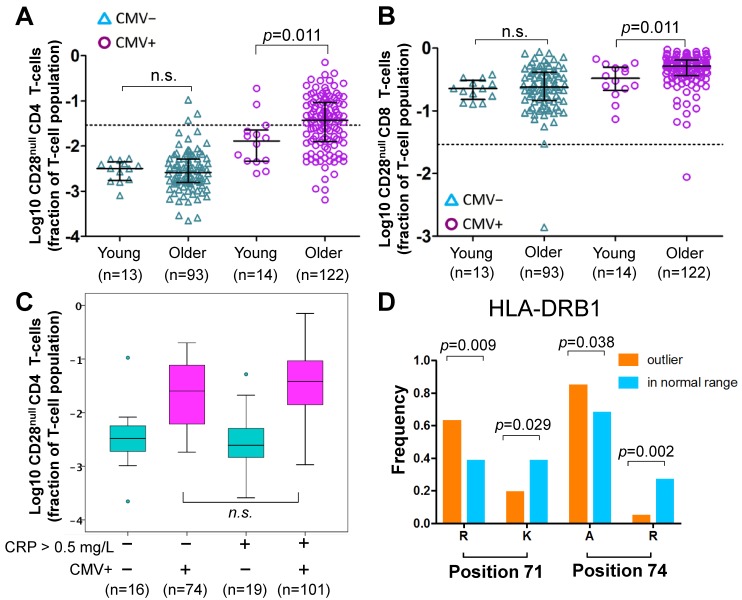
Figure 3.
Effect of age, HLA and CRP on CD28null CD4 T-cells. (A-B) Scatterplots show differences in CD28null CD4 (A) and CD8 (B) T-cell frequencies between young and older CMV- and CMV+ people (n.s.= not significant). CD28null T-cell fractions were log10-transformed for better visualization. (C) Box-plots show the levels of CD28null CD4 T-cell frequencies in four subgroups based on CMV infection status (CMV- green, CMV+ red) and CRP levels (≤ 5 mg/L or >5mg/L). (D) Bar-charts show significant differences in the frequencies of arginine (R), lysine (K), and alanine (A) at positions 71 and 74 of exon 2 of HLA-DRB1 in individuals with and without expansions. Significance levels are indicated.

