Figure 4.
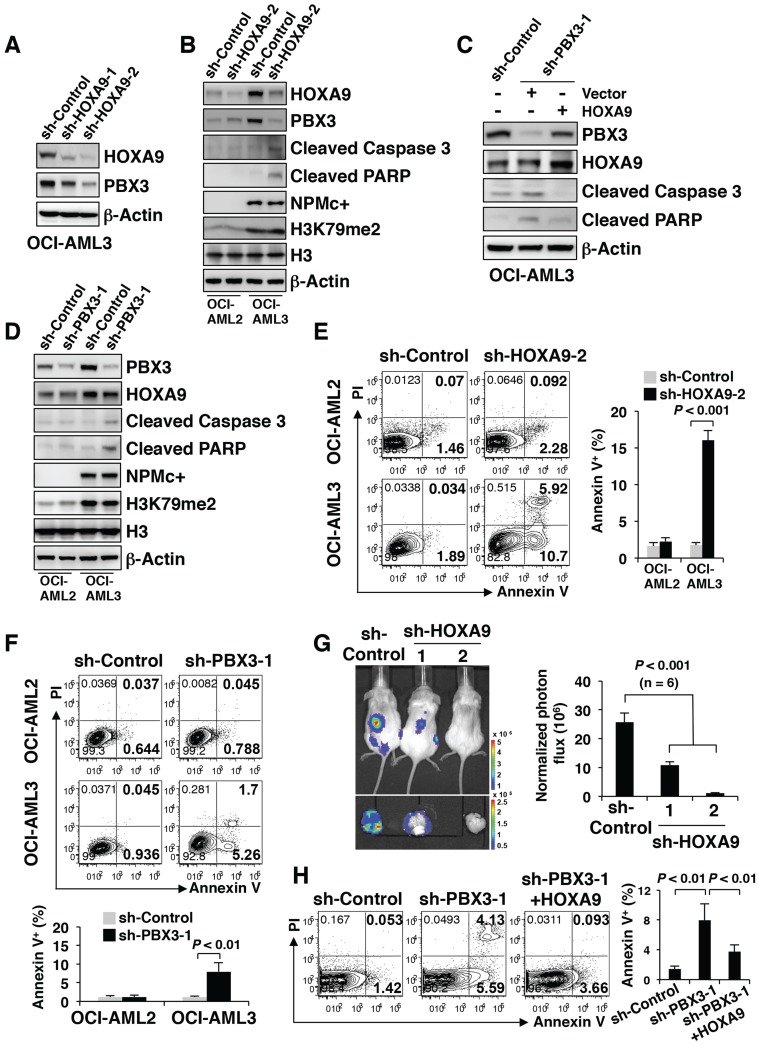
PBX3 is positively regulated by HOXA9 and both were important for NPMc+ cell survival. (A) Western blot of HOXA9 and PBX3 in OCI-AML3 cells stably transduced with scramble shRNA (sh-Control) or shRNAs targeting HOXA9 mRNA (sh-HOXA9-1 and sh-HOXA9-2). The measurement of protein level was from three independent western blotting replicates. (B) Lentiviruses carrying sh-Control or sh-HOXA9-2 were used to transduce OCI-AML2 and OCI-AML3 cells. Western blot shows the protein levels of HOXA9, PBX3, cleaved caspase 3, cleaved PARP, NPMc+ and H3K79me2 in the transduced cells. Three independent western blotting replicates were performed. (C) OCI-AML3 cells were stably transduced with sh-Control or shRNA targeting PBX3 mRNA (sh-PBX3-1), followed by lentivirus transduced with carrying vector or HOXA9. In these constructed cells, the expression levels of HOXA9, PBX3, cleaved caspase 3 and cleaved PARP were detected by western blot. Three independent western blotting replicates were performed. (D) sh-Control or sh-PBX3-1 was used to transduce OCI-AML2 and OCI-AML3 cells by lentiviruses. Western blot presenting the protein levels of PBX3, HOXA9, cleaved caspase 3, cleaved PARP, NPMc+ and H3K79me2 in the stably transduced cells. The measurement of protein level was from three independent western blotting replicates. (E) Scatter plots present the apoptotic cells (Annexin V+) in OCI-AML2 and OCI-AML3 strains with or without HOXA9 mRNA knockdown. Column diagram showing the percentage of Annexin V+ cells in transduced OCI-AML2 and OCI-AML3 strains. The values are presented as the mean ± SEM (n=6 per group). (F) Representative FACS plots of the number of apoptotic cells (Annexin V+) in OCI-AML2 and OCI-AML3 cells with or without PBX3 mRNA knockdown. Column graphs show the mean ± SEM of 6 independent experiments for each group. (G) A representative bioluminescence image of mice transplanted with OCI-AML3 cells stably expressing sh-Control, sh-HOXA9-1 or sh-HOXA9-2. Quantitative luciferase bioluminescence was monitored at day 30 post-xenografting. The values are presented as the mean ± SEM (n=6 per group). (H) Representative flow cytometry plots displaying the number of apoptotic cells (Annexin V+) in OCI-AML3 cells stably transduced with HOXA9 after knockdown of PBX3 mRNA. A column diagram shows the percentage of Annexin V+ cells in the transduced cells. The values are presented as the mean ± SEM (n=6 per group).

