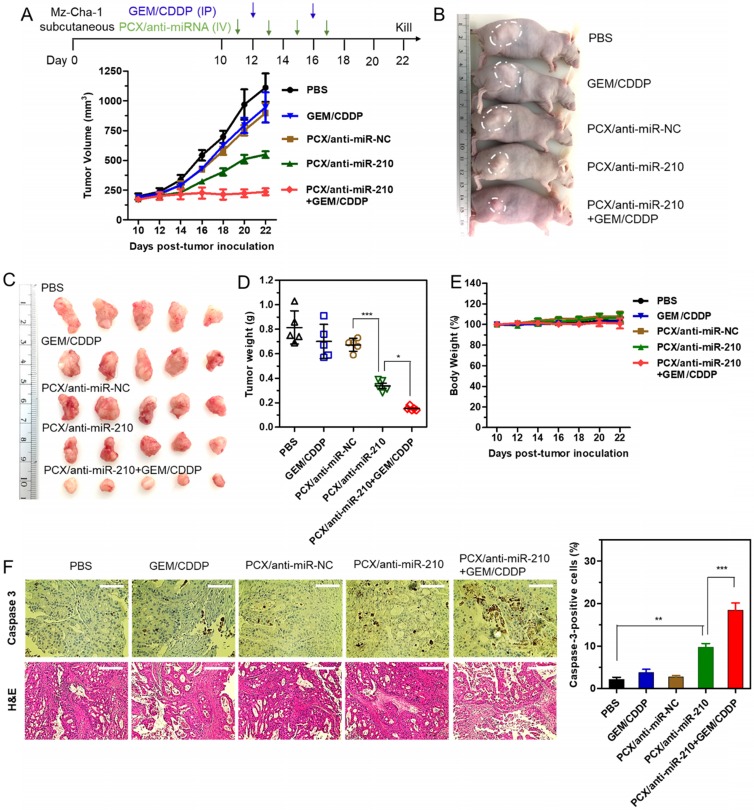
Figure 7.
Antitumor efficacy in a CCA xenograft model. (A) Mz-ChA-1 tumor growth after intravenous injection of PCX/anti-miRNA (2.4 mg/kg PCX, 1.2 mg/kg anti-miRNA) and intraperitoneal injection of GEM/CDDP (15 mg/kg GEM, 1.5 mg/kg CDDP). Data are shown as mean ± SD (n = 5). (B) Representative images of the mice on day 22. (C) Tumor tissues resected from mice on day 22. (D) Weights of tumors collected from the sacrificed mice. Data are shown as mean ± SD (n = 5). (E) Body weight during the treatment. Data are shown as mean ± SD (n = 5). (F) Caspase-3 immunohistochemistry analysis (magnification 40×, scale bar 100 µm.) and H&E staining (magnification 20×, scale bar 200 µm.) of tumor tissues after various treatments. The percentage of caspase-3-positive cells in tumors. Data are shown as mean ± SD (n = 3). *P < 0.05, **P < 0.01, ***P < 0.001.

