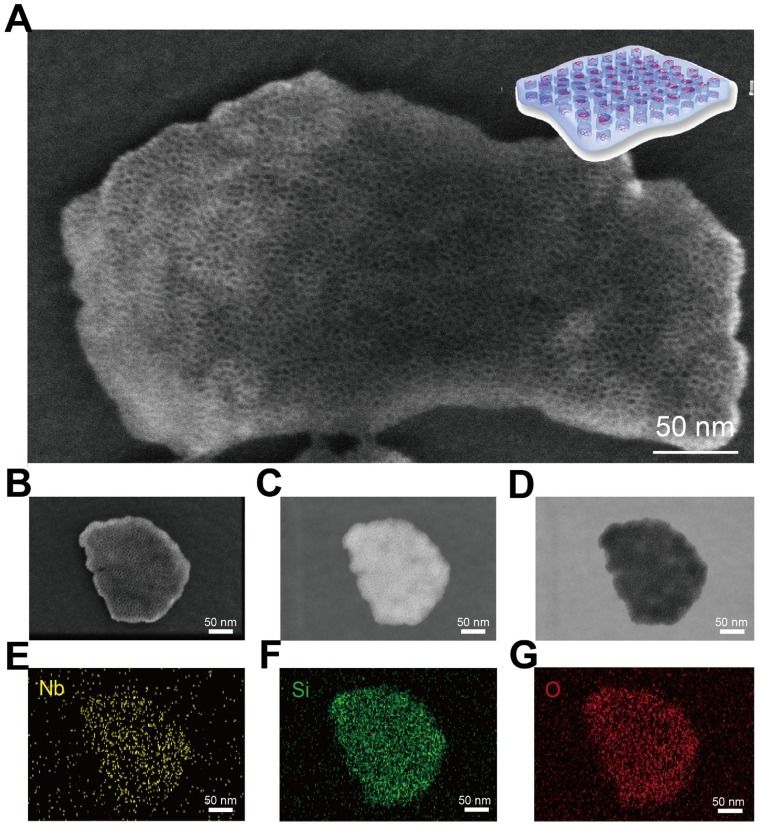
Figure 2.
Morphology, microstructure and composition characterization of core/shell-structured CTAC@Nb2C-MSN. (A) High-resolution SEM image of CTAC@Nb2C-MSN composite nanosheets. (B-G) Detailed characterization of a single CTAC@Nb2C-MSN composite nanosheet, including (B) SEM image, (C) dark-field TEM image, (D) bright-field TEM image and (E-G) corresponding element mapping of the same nanosheet (e: Nb, f: Si, and g: O elements). Scale bars of (B-G) are 50 nm.

