Figure 6.
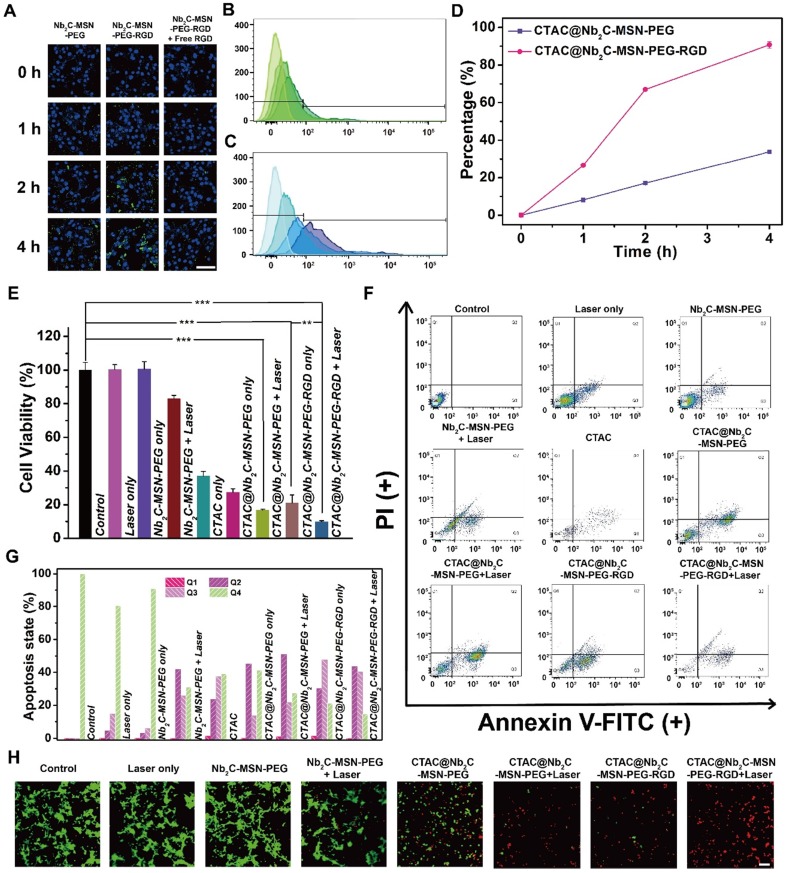
In vitro chemo/PTT-based enhanced cancer therapy against U87 cancer cells. (A) CLSM images of U87 cells incubated with FITC-labeled Nb2C-MSN-PEG and Nb2C-MSN-PEG-RGD at a concentration of 100 μg/mL for 0, 1, 2 and 4 h. Scale bar: 40 μm. Flow cytometry result of intracellular uptake of (B) FITC-labeled CTAC@Nb2C-MSN-PEG and (C) CTAC@Nb2C-MSN-PEG-RGD after incubation with U87 cells for different time intervals (0, 1, 2 and 4 h) and (D) corresponding uptake percentage analysis to show the targeting efficacy. (E) Relative cell viability of U87 cells after 24 h incubation by different treatments, including control (without treatment), laser only, Nb2C-MSN-PEG only, Nb2C-MSN-PEG combined with laser irradiation, CTAC only group, CTAC@Nb2C-MSN-PEG only, CTAC@Nb2C-MSN-PEG combined with laser irradiation, CTAC@Nb2C-MSN-PEG-RGD only, and CTAC@Nb2C-MSN-PEG-RGD combined with laser irradiation (**P < 0.01, ***P < 0.001). The scale bar is 40 μm. (F) Flow cytometry apoptosis assay of U87 cells under different treatments followed by staining with Annexin-FITC and PI and (G) corresponding quantitative analysis of U87 cells at different stages (Q1: dead cells; Q2: late apoptotic cells; Q3: early apoptotic cells; Q4: live cells). (H) CLSM images of U87 cells after different treatments, followed by staining with PI (red fluorescence) and calcein-AM (green fluorescence) (Scale bar: 40 μm).

