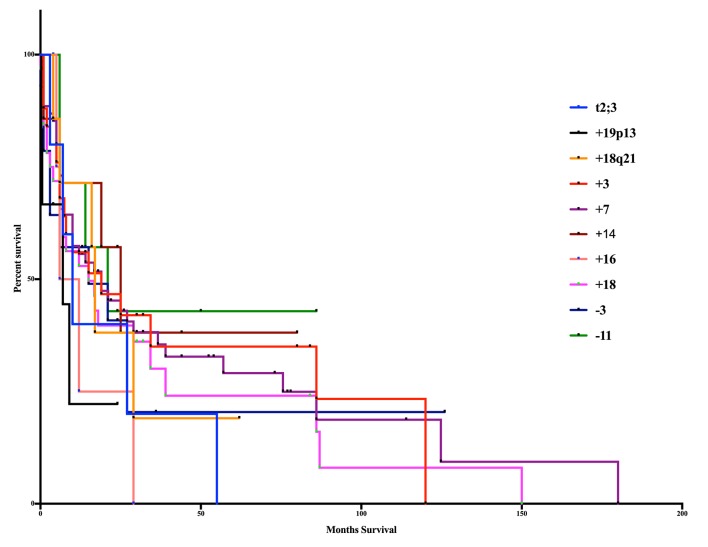
Figure 2.
Kaplan-Meier curve of age-based aberrations. The 10 significant aberrations did not show any significant differences from one another (log-rank test, P = 0.7512, Gahen-Breslow-Wilcoxon test, P = 0.8759). The poorest overall survival occurred in patients with the addition of 19p13 (7m) and trisomy 16 (9m). Superior survival occurred in those patients in trisomy 14 (25m), monosomy 11 (21m), trisomy 3 (19m) and trisomy 7 (19m).

