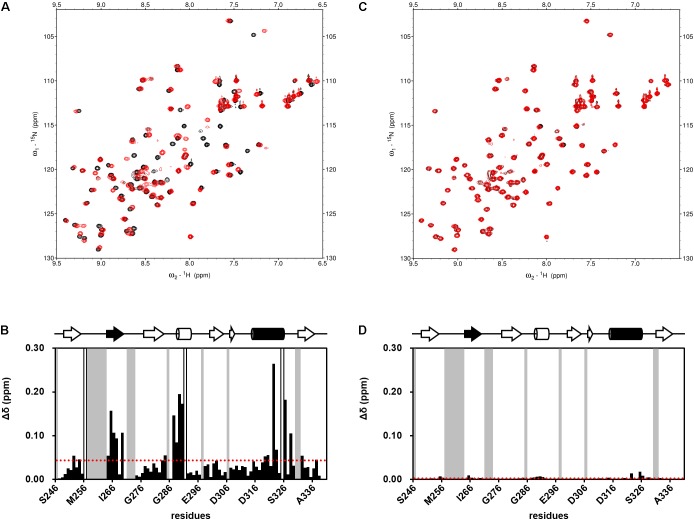
FIGURE 4.
Examples of NMR titration of PDZ domains with compounds (A,C) and their normalized chemical shift changes (B,D). (A,B) NPL-3009. (C,D) NPL-3003. (A,C) each overlaid spectrum was derived from 0.1 mM hDvl1-PDZ with (red) and without (black) the 0.2 mM of compound. The signals with markedly large CSPs were boxed and indicated with the residue numbers. (B,D) normalized chemical shift changes Δδ is plotted against residue numbers. Gray residues are missing or unassigned residues, and white residues indicate Pro. The secondary structure of hDvl1-PDZ is shown at the top of the figures, whereas α2 and β2 are shown in black.

