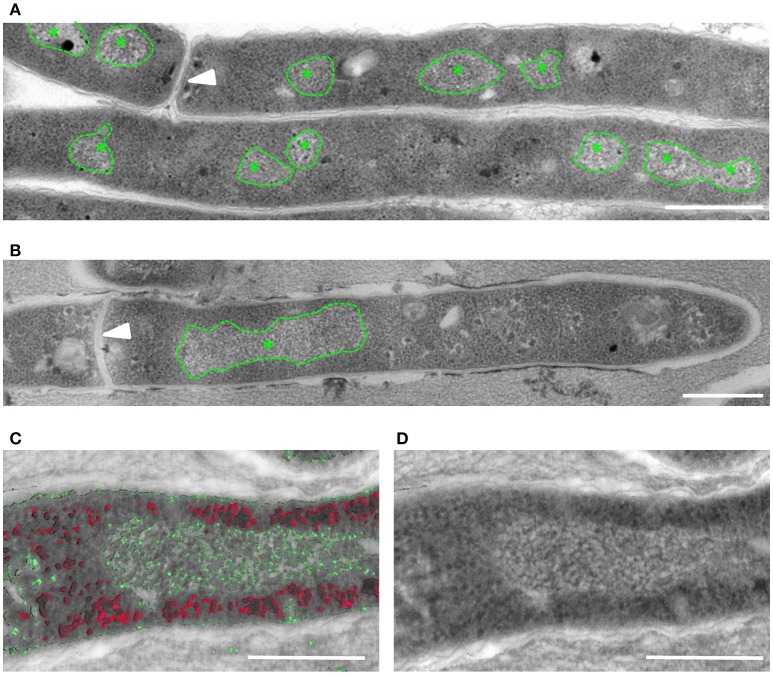
Figure 1.
Altered localization of DNA visible in M. smegmatis after FA treatment. TEM-images of ultrathin (80 nm) sections of untreated (A) and FA-treated (B) M. smegmatis showing a single, enlarged area with typical DNA structure (*) in the FA treated bacteria. (C,D) Tomogram slices containing a semi-thick (300 nm) section of FA treated M. smegmatis. Stacks are artificial color coded based on electron-density, with in red e-dense ribosome-like structures, in green DNA clusters (C), and the separate TEM image (D). Arrowhead indicates septum, * indicates typical DNA structure and all scale bars represent 500 nm.

