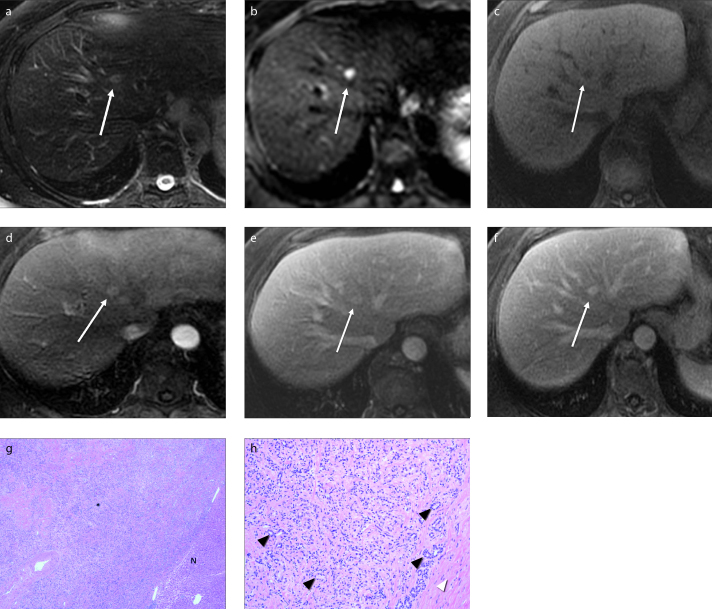
Figure 4. a–h.
MRI of BDA. BDA (white arrow) appears hyperintense on T2-weighted (a) and diffusion-weighted (b) images, and hypointense on T1-weighted (c) image. On contrast-enhanced arterial phase (d), the lesion shows hyperenhancement that persists through portal (e) and delayed (f) phases. Histology of lesion with low power (g, 40× original magnification, H-E stain) shows the neoplasm (asterisk) on left and normal liver parenchyma (N) in right lower corner. Higher magnification (h, 100× original magnification) shows multiple undilated bile ductules (black arrowheads) surrounded by variable bands of fibrous tissue (white arrowhead).

