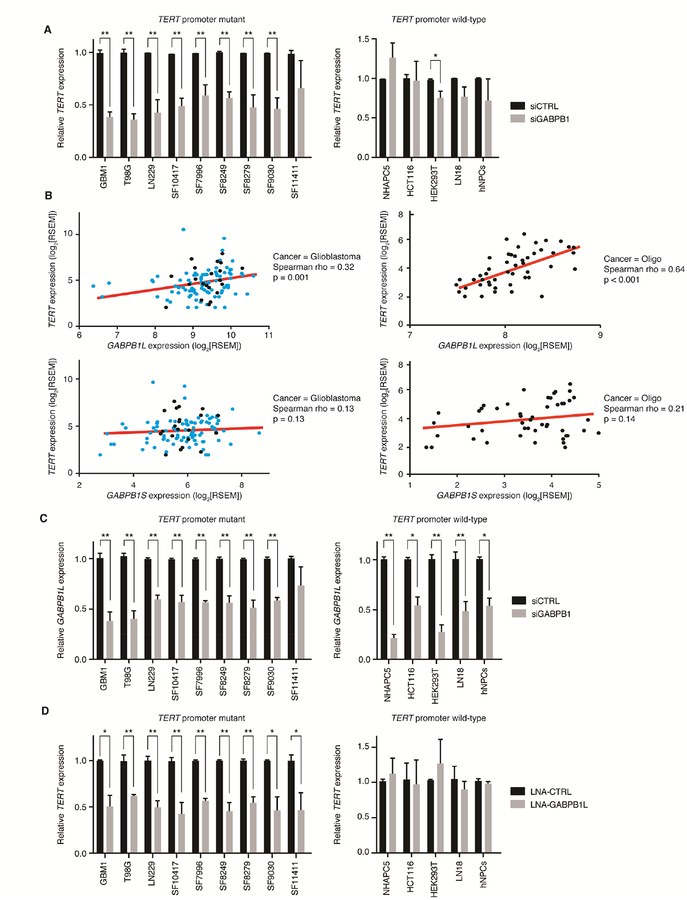
Figure 1.
The GABP tetramer-forming isoform β1L positively regulates TERT expression solely in TERT promoter mutant tumor cells. (A) TERT expression following siRNA-mediated knockdown of β1 (siGABPB1) in TERT promoter mutant (left) or TERT promoter-wild-type (right) cell lines and primary cultures. *p value<0.05, **p value<0.01, two-sided Student’s t-test compared to a non-targeting siRNA control (siCTRL) in each respective line. (B) Correlation of GABPB1L (top graphs) or GABPB1S (bottom graphs) expression (log2[RSEM normalized counts]) versus TERT expression (log2[RSEM normalized counts]) from 109 TERT-expressing GBMs (left graphs) or 49 TERT promoter-mutant oligodendrogliomas (right graphs). Red line indicates trend line. Black points indicate Sanger-validated TERT promoter mutant GBM and oligodendroglioma samples, teal points are GBM samples that were not tested for TERT promoter mutation status. Spearman’s Rank-Order Correlation was used to generate Spearman rho and p values for each correlation. (C) GABPB1L expression following siRNA-mediated knockdown of β1 (siGABPB1) in TERT promoter mutant (left) and wild-type (right) lines. *p value<0.05, **p value<0.01, two-sided Student’s t-test compared to a non-targeting siRNA control (siCTRL) in each respective line. (D) TERT expression following LNA-ASO knockdown of β1L (LNA-GABPB1L) in TERT promoter mutant (left) or wild-type (right) cell lines and primary cultures compared to a control LNA-ASO (LNA-CTRL). *p value<0.05, **p value<0.01, two-sided Student’s t-test compared to LNA-CTRL in each respective line. Values are mean ± S.D. of at least three independent experiments (A, C, and D; two independent experiments for SF10417). See also Figure S1.

