
Fig. 3.
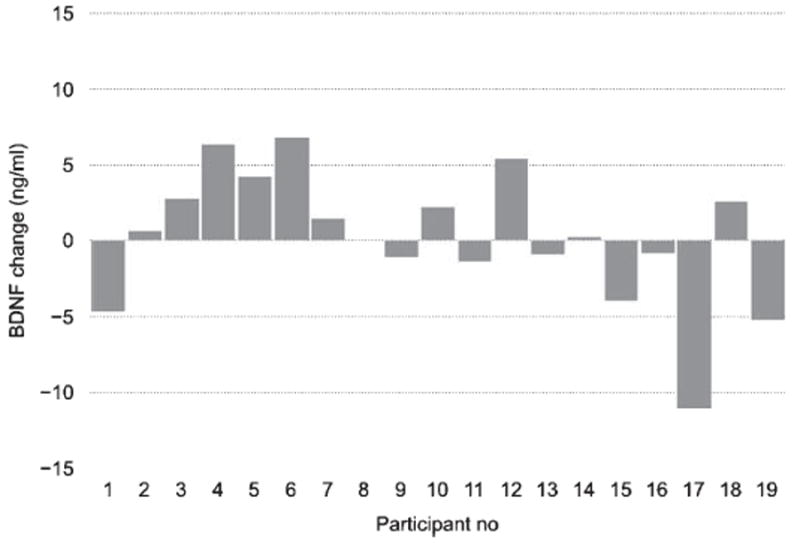
BDNF response to cognitive training for each participant. Each bar depicts the change in BDNF level between the average post-intervention BDNF level (across the three time points) in relation to the baseline (pre-session) level for each participant in the cognitive training condition.