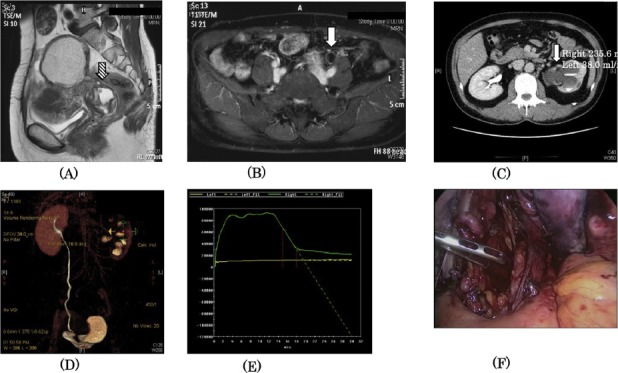
Fig. 1.

Colonel T2-W1 MRI shows (A) endometrioma and strong adhesion between posterior wall of uterus and rectum (hatched arrow) and (B) the left hydroureter (white arrow). (C) CT scan axial view shows hydronephrosis (white arrow) in left kidney. (D) 3D volume rendered images created from Computed tomography urography doesn’t show the imaging of left ureter, however detects left renal cortex. (E) In 99mTc-mercaptoacetyltriglycine (99mTc-MAG3) renogram, the effective renal plasma flow of the left kidney markedly decreased and showed no peak curve. (F) Laparoscopic view demonstrating left ureter (white arrow) above the level of the uterosacral ligament (hatched arrow), which is infiltrated by endometriosis.
