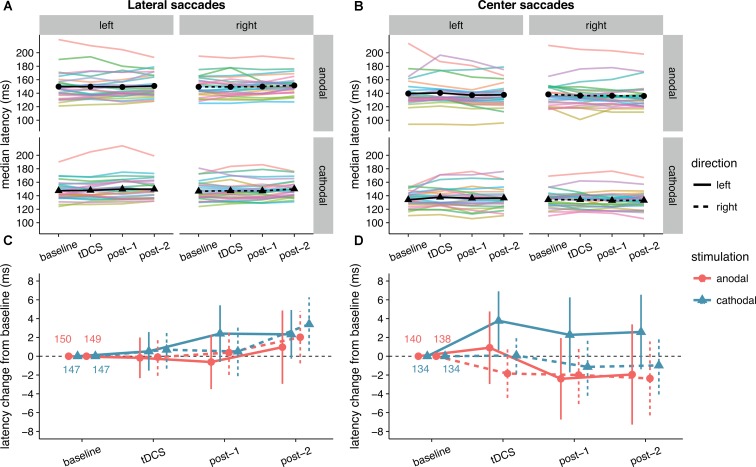
FIGURE 4.
Effects of frontal eye field tDCS on saccade latency. Data are shown for left vs. rightward saccades, in the anodal vs. cathodal session, for four 15-min time periods: baseline, during tDCS, and after tDCS (post-1 and post-2). (A) (Lateral saccades) and (B) (center saccades): Colored lines show data from individual participants; black lines show the group median. (C) (Lateral saccades) and (D) (center saccades): Change in saccade latency after baseline subtraction. Numbers inside the plot axes are the baseline saccade latencies per condition. Error bars show 95% confidence intervals of the pairwise difference between baseline and each subsequent time period.

