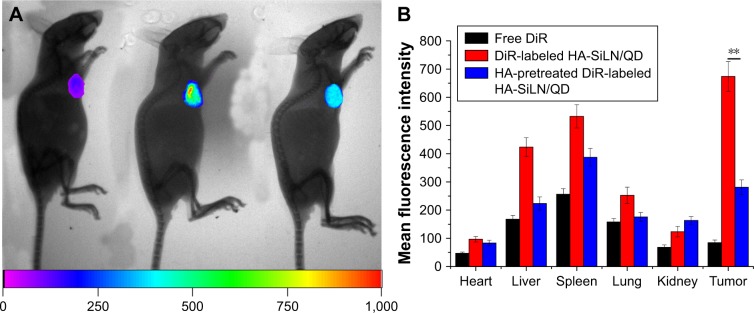
Figure 7.
(A) In vivo distribution of free DiR, DiR-labeled HA-SiLN/QD, and HA-pretreated DiR-labeled HA-SiLN/QD at 24 hours postinjection (left: free DiR; middle: DiR-labeled HA-SiLN/QD; right: HA-pretreated DiR-labeled HA-SiLN/QD). (B) Region-of-interest analysis of fluorescent signals from the tumors and normal tissues. Data are shown as mean ± SD (n=3). **P<0.01.
Abbreviation: HA, hyaluronic acid.

