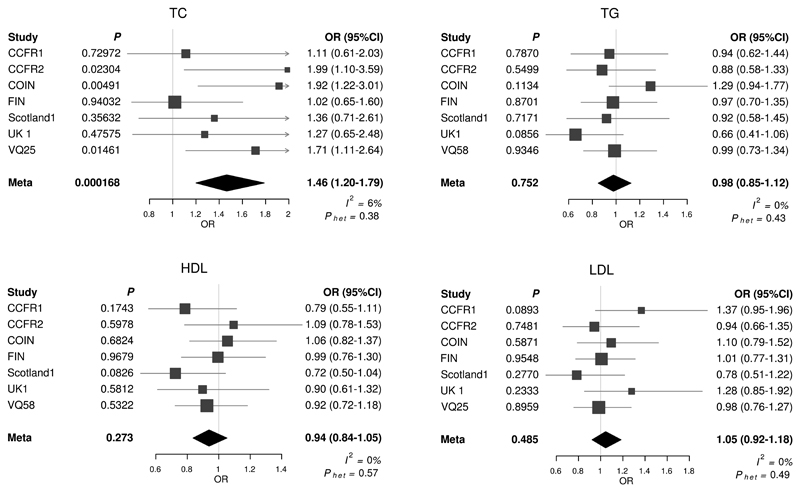
Figure 1. Meta-analysis odds ratios (OR) for colorectal cancer per unit increase in genetic risk score (SD trait) for each lipid trait.
TC: Total cholesterol, TG: Triglyceride, LDL: low density lipoprotein, HDL: high density lipoprotein; Horizontal lines: 95% Confidence Intervals (95% CI). Phet: P-value for heterogeneity; I2: proportion of the total variation due to heterogeneity. Box: OR point estimate; its area is proportional to the weight of the study. Diamond: overall summary estimate, with confidence interval given by its width. Vertical line: null value (OR = 1.0).

