
Figure 4.
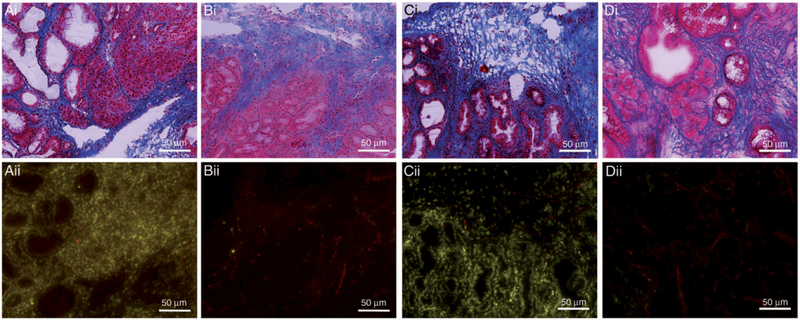
Representative images of serial sections stained with Masson’s trichrome (i) and fluorescent imaging (ii). Images demonstrate the distribution of doxorubicin and blood vessels within pancreatic tumours treated with LTSL-Dox + MR-HIFU (A); LTSL alone (B); DOX + MR-HIFU (C) OR Dox alone (D).