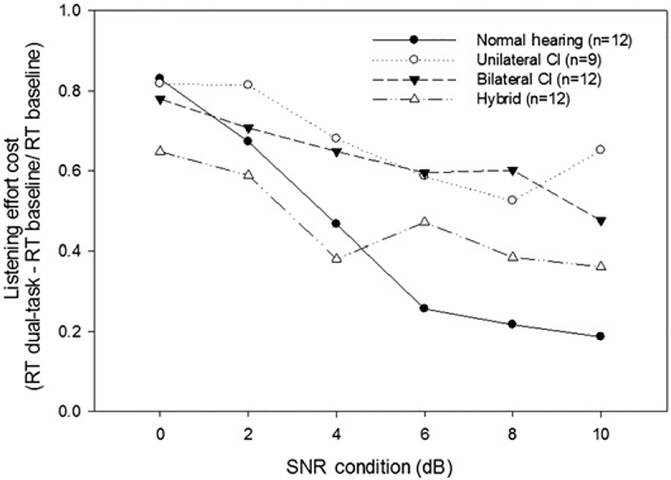
Figure 3.
Listening effort on the Stroop test (secondary task) for all participant groups. Listening effort was calculated by comparing the proportional change in median RT scores from baseline as follows: [(RT on dual task 2 RT baseline)/RT baseline]. The filled circles show results for the normal-hearing group, the open circles for the unilateral CI group, the filled triangles for the bilateral CI group, and the open triangles for the hybrid short-electrode CI group. Results for all six SNR conditions are displayed on the x axis and listening effort is displayed on the y axis.

