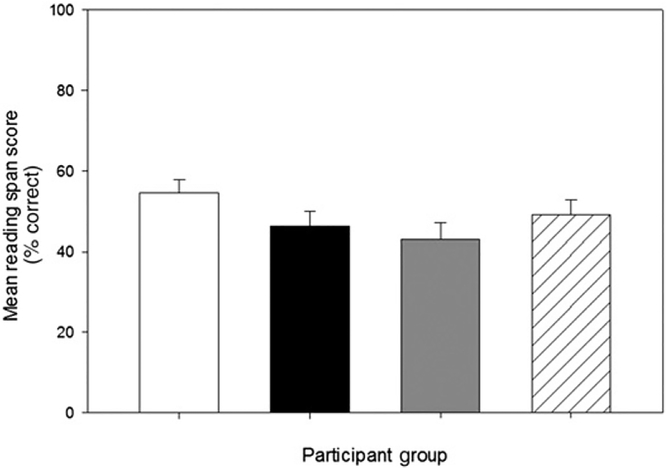
Figure 4.
Mean percent correct scores on the reading span test for all participant groups. The white bar shows results for the normal-hearing group, the black bar for the unilateral CI group, the gray bar for the bilateral CI group, and the dashed bar for the hybrid short-electrode CI group. Results by group are displayed on the x axis and percent correct is displayed on the y axis.

