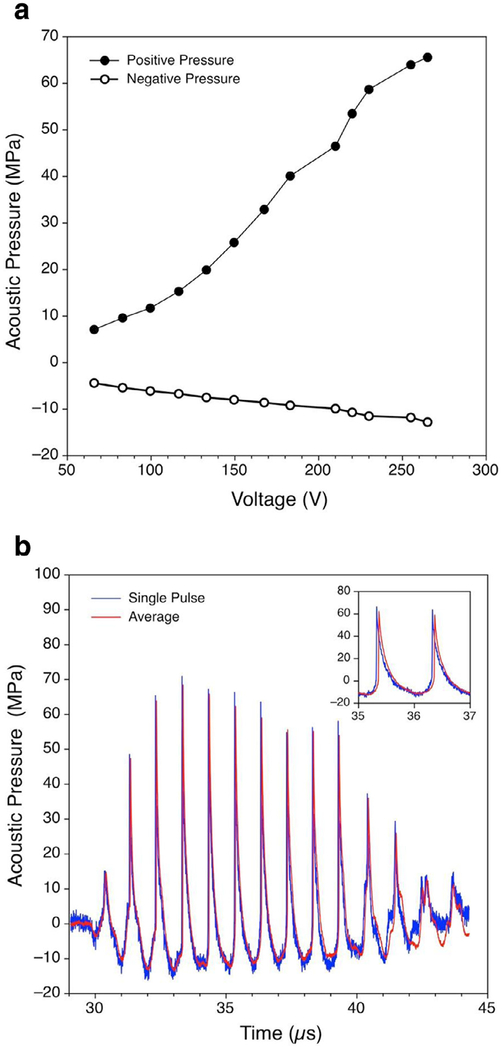
Fig. 2.
Acoustic characterization results. (a) Peak positive and peak negative pressures in acoustic waveforms measured by a fiber optic probe hydrophone at the focus in water versus peak driving voltage applied to the transducer. (b) Focal pressure waveforms (single pulse and averaged over 100 pulses) with a peak positive pressure of +65 MPa and a peak negative pressure of −12.8 MPa measured at the highest output level of 265 V peak, at which sonication of biological samples was performed. Note the presence of steep shock fronts up to 65 MPa amplitude formed in the pulse waveform because of non-linear propagation effects.

