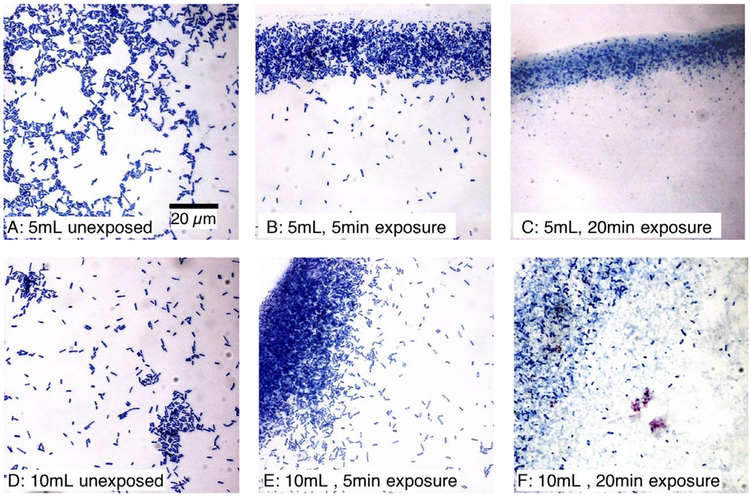
Figure 5.
Appearance of E. coli cells from 5-mL (a–c) or 10-mL (d–f) samples stained using the Romanovsky-Giemsa method. The images are not quantitative. (b, e) Material seems to be intact cells and cellular debris appears to be absent. However, the surviving fraction (SF) was (b) 0.26 ± 0.07, and (e) 0.51 ± 0.16. (c) Materials seem to be made up of cellular debris; SF at this exposure time was 0.004 ± 0.001. (f) Many apparently intact cells are visible. The associated SF was consistent with this observation, being 0.05±0.04 (i.e., about 10-fold greater than in [c]).

