Figure 4.

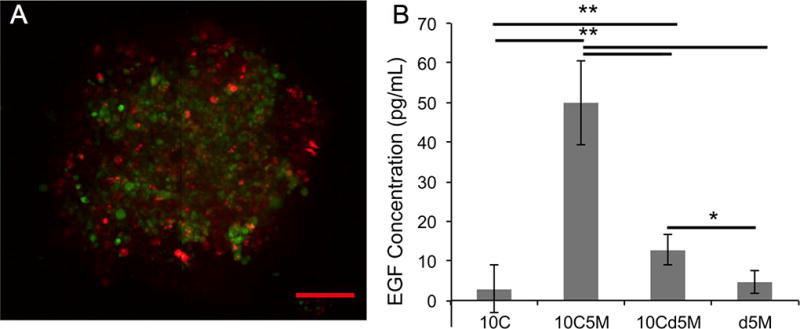
(A) An overlaid optical image of a spheroid with stained MDA-MB-231 cancer cells (green) and RAW 264.7 macrophages (red) shows the two cells types throughout the spheroid. The scale bar is 100 µm for the image. (B) Cytokine based interaction of macrophages and tumor cells as monitored by EGF concentration detected via an ELISA from the four models (10,000 cancer cells (10C); a heterospheroid with 10,000 cancer cells and 5,000 macrophages (10C5M); a 10,000 cancer cell spheroid surrounded by 5,000 macrophages (10Cd5M); n=4; (** p<0.005, *p<0.05). Reprinted from reference 64 with permission from Elsevier.
