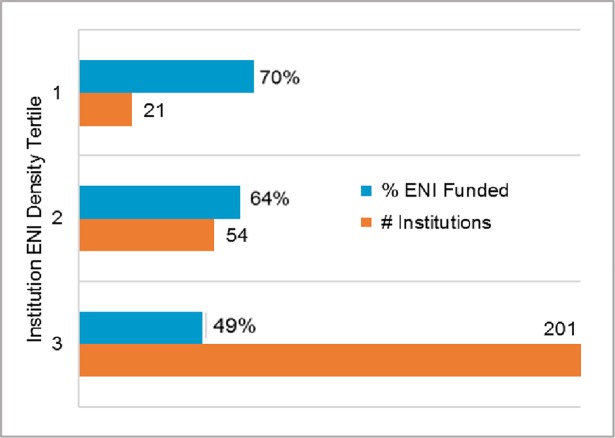
Fig 3. ENI funding outcomes by index institution ENI density.
Index institution density tertiles: 1 = 14 to 37 ENI per institution; 2 = 6 to 13 ENI per institution; 3 = 1 to 5 ENI per institution. ENI from institutions in tertiles 1 and 2 were more likely to be funded (70% and 65%, respectively) than ENI from institutions in tertile 3 (47%) (p < 0.0001). The highest ENI funding rate (70%) was in the 1st tertile, which included just 21 institutions.

