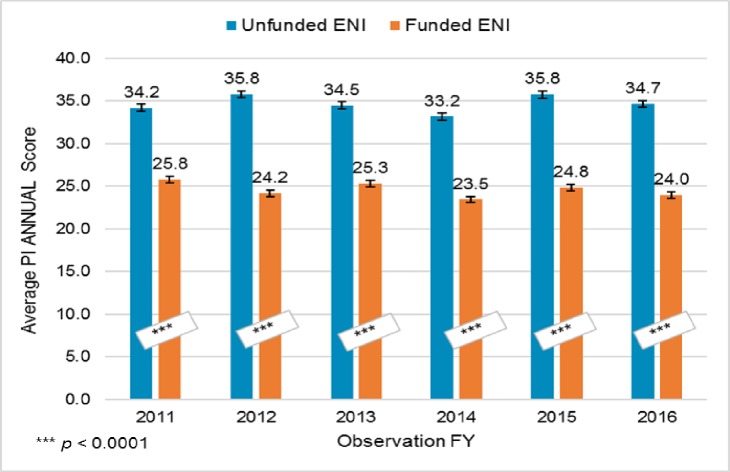
Fig 6. Average PI ANNUAL scores, FY 2011 –FY 2016.
The PI ANNUAL Score each year is the average of individual PI ANNUAL scores of ENI who submitted scored applications. Average PI ANNUAL Scores were markedly different between the funded and unfunded ENI, with funded ENI having PI ANNUAL Scores about 10 percentile points lower each year between 2011 and 2016. (Welch Two Sample t-tests: in all years p-values < 0.0001.).

