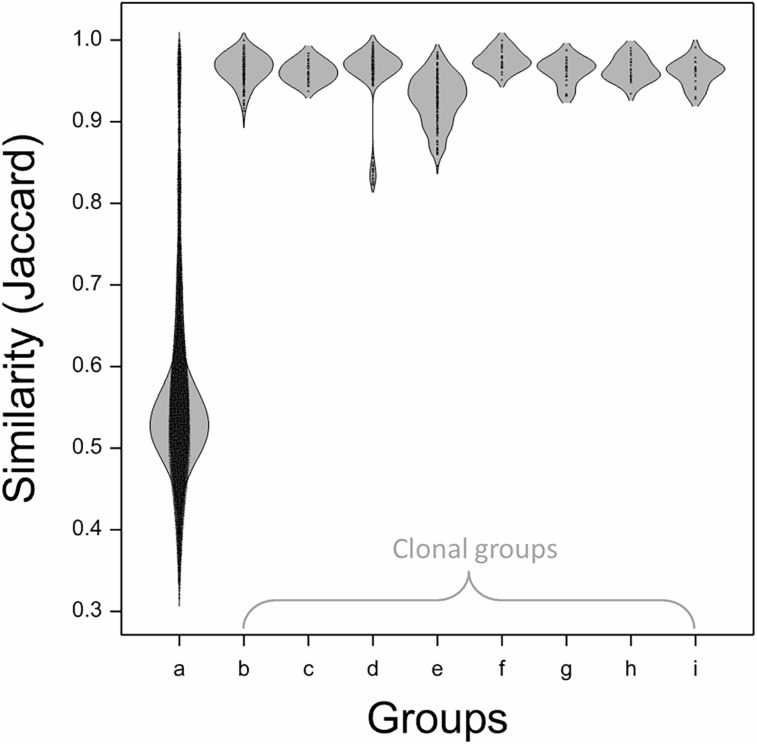
Fig 2. Distribution of similarity across the whole collection (2138 accessions) and a series of documented clones of major international cultivars.
1D Density plot as produced in Genstat using a bandwidth of 0.75. All similarity values were calculated using the Jaccard coefficient. Documented clones were as identified in the NFC database and archive. Groups are as follows: (a) all 2138 accessions including clonal samples; (b-i) clonal samples of ‘Cox’s Orange Pippin’, ‘Delicious’, ‘Golden Delicious’, ‘Jonagold’, ‘Jonathan’, ‘McIntosh’, ‘Northern Spy’ and ‘Rome Beauty’.

