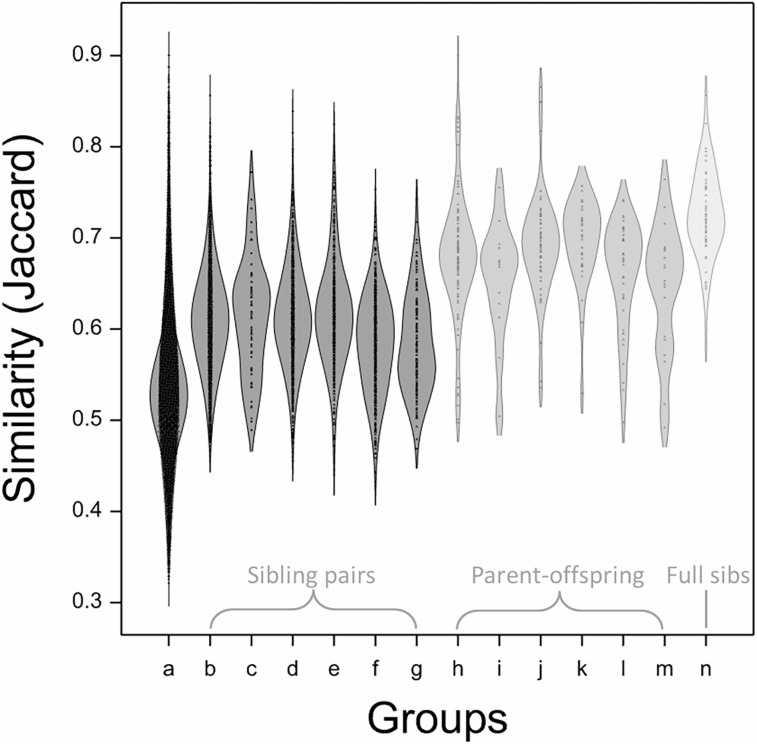
Fig 3. Distribution of similarity across all non clonal or duplicate members of the collection (1777 accessions) and a series of documented siblings, parent-offspring and full-sibs.
1D Density plot as produced in Genstat using a bandwidth of 0.75. All similarity values were calculated using the Jaccard coefficient. Documented relationships were as identified in the NFC database and archive. Groups are as follows: (a) all 1777 accessions including siblings and parents; (b-g) similarity between documented (half- and full-) sibling offspring of ‘Cox’s Orange Pippin’, ‘Delicious’, ‘Golden Delicious’, ‘Jonathan’, ‘McIntosh’ and ‘Worcester Pearmain’; (h-m) similarity between documented offspring of ‘Cox’s Orange Pippin’, ‘Delicious’, ‘Golden Delicious’, ‘Jonathan’, ‘McIntosh’, ‘Worcester Pearmain’ and their respective parent; (n) similarity between documented full-sibling offspring from crosses between ‘Cox’s Orange Pippin’ and ‘Golden Delicious’, ‘Jonathan’ or ‘McIntosh’ and between ‘Jonathan’ and ‘Delicious’ or ‘Golden Delicious’.

