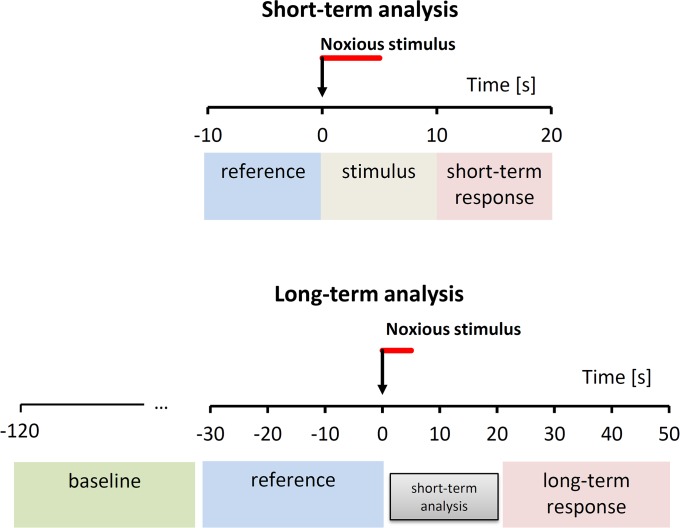
Fig 2. Reference and response periods for short-term and long-term analysis.
Time series are split into consecutive blocks of 10 s; short- and long-term autonomic responses are quantified as increments from “reference” to “response” periods. The arrows indicate the application of the stimulus, with its 5-s duration highlighted by the red bar. References are the 10-s period (short-term) or 30-s period (long-term) preceding the stimulus; response periods have the same length of reference periods and start few seconds after the cessation of the stimulus (short-term response) or after the period selected for the short-term analysis (long-term response). Short-term analysis also quantifies changes during the “stimulus” condition; long-term analysis also consider a 90-s baseline period for evaluating if the operators interacting with the patient before the administration of the stimulus may have influenced the variables measured in the reference period.

