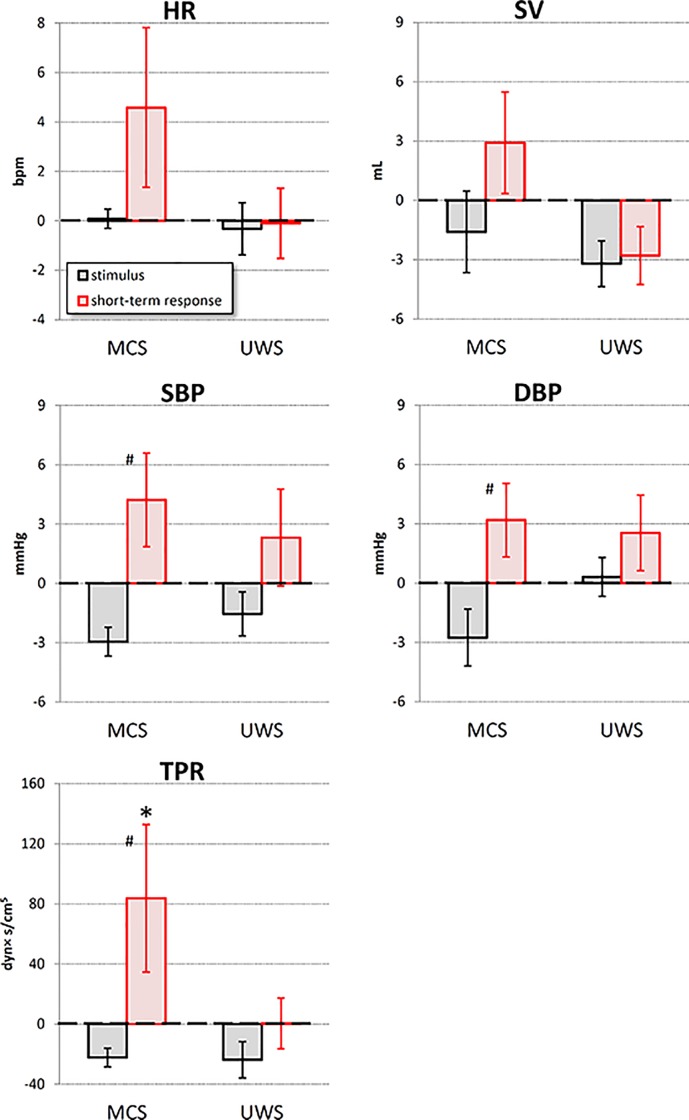
Fig 4. Short–term analysis of the noxious stimulus in MCS and UWS patients.
Grey bars: increments from “reference” to “stimulus” condition; red bars: increments from “reference” to “response” condition: values as mean ± sem; the * indicates increments significantly different from 0, the # indicates significant differences between “stimulus” and “response” increments (p<0.05).

