FIGURE 3.

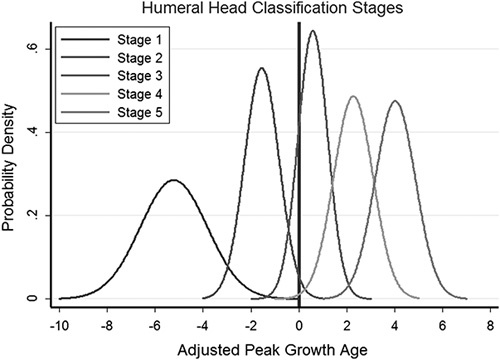
Normalized distribution of staging with age to PHV (years) on the x-axis and proportion of observations on the y-axis. A vertical line is drawn at PHV occurring between stages 2 and 3. PHV indicates peak height velocity.

Normalized distribution of staging with age to PHV (years) on the x-axis and proportion of observations on the y-axis. A vertical line is drawn at PHV occurring between stages 2 and 3. PHV indicates peak height velocity.