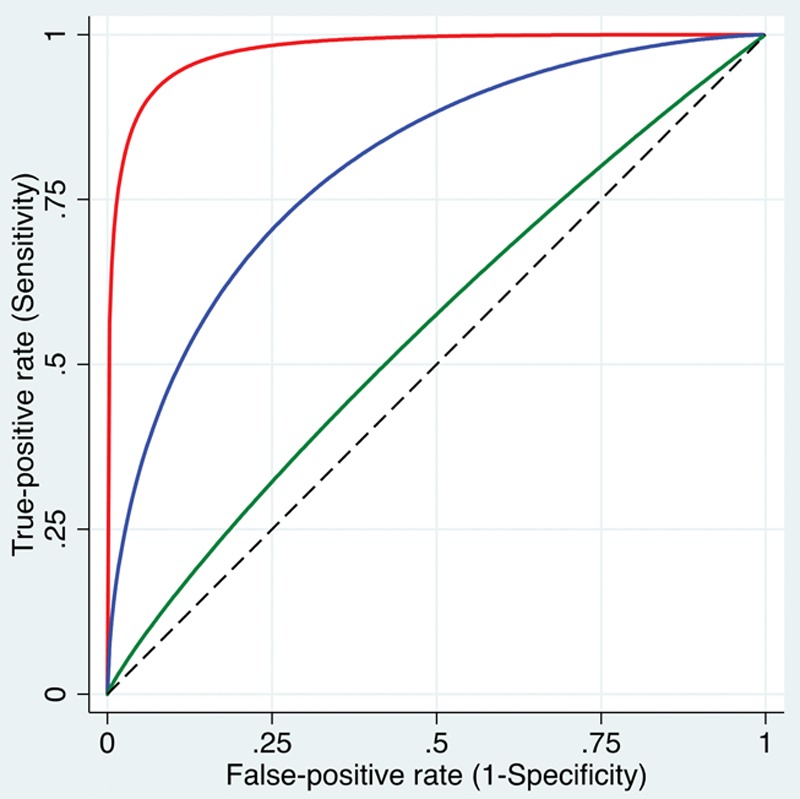
Figure 3.

ROC curves are plots of the true-positive rate (sensitivity) against the false-positive rate (1 − specificity) for a range of different cutoff values. Shown are 3 smoothed curves, visually representing high (red curve close to the left top corner), intermediate (blue curve), and low (green curve close to the dashed diagonal line) discriminative ability to distinguish patients with a condition from patients without the condition. More formally, the AUC can be calculated, where an AUC close to 1 indicates high discriminative ability and an AUC close to 0.5 (representing the area under the diagonal line) indicates that the test is no better in predicting the condition than tossing a coin. AUC indicates area under the curve; ROC, receiver operating characteristic.
