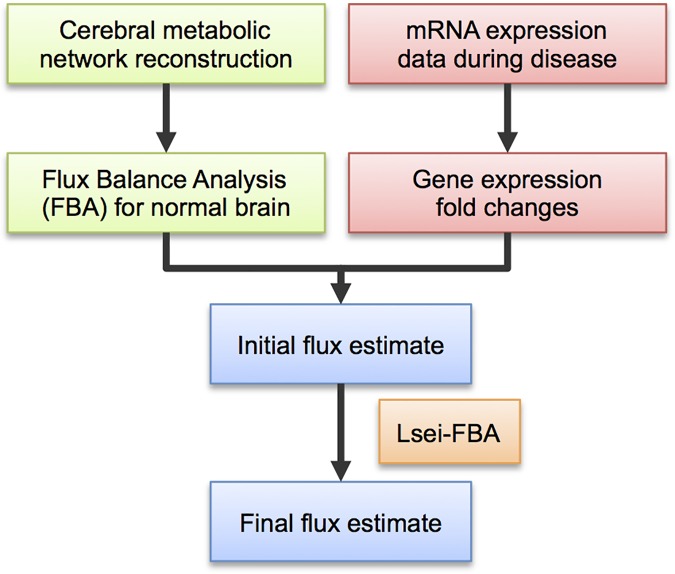
Fig 1. Diagram for the workflow of the Lsei-FBA approach.
Flow diagram of the steps to predict metabolic fluxes for the normal brain (green boxes) and for diseased brain based on gene expression data (pink boxes) described in the Methods section. For the normal brain, the flux distribution was computed from a reconstructed model of cerebral central carbon metabolism. For the diseased brain, mRNA gene expression fold changes were first computed for patients with Parkinson’s disease (PD) versus a control group. An initial flux estimate for the diseased brain is computed for each reaction in the network by multiplying gene expression fold changes with the FBA flux predictions for the normal brain. The final flux estimate is solved subject to i) forward flux in irreversible reactions, ii) maintaining the balance of fluxes during chronic disease and iii) a least squares cost function to minimize the sum of the squared deviations between the initial and the final flux estimate.

