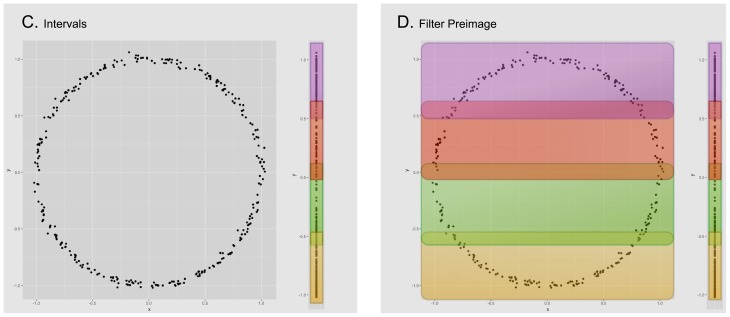
Fig 2. We now divide the image of the data set (under the filter function) into evenly distributed overlapping intervals (image C) and compute the corresponding points in their pre-image (image D).
Notice how each pair of overlapping intervals, defines two different subsets of data that can have elements in common.

