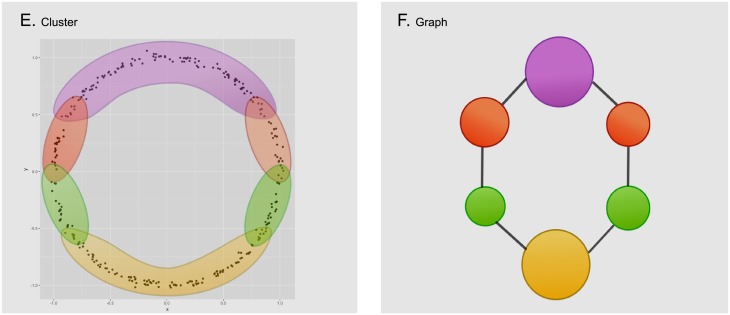
Fig 3.
Inside every defined subset of data, we execute a clustering algorithm to detect isolated groups of points (image E). Each of the resulting groups will correspond to a node on the output graph (image F). Notice how nodes are joined together by edges when their corresponding groups have points of the data set in common. Also, the size of the node in the cluster corresponds to the amount of points in its corresponding group.

