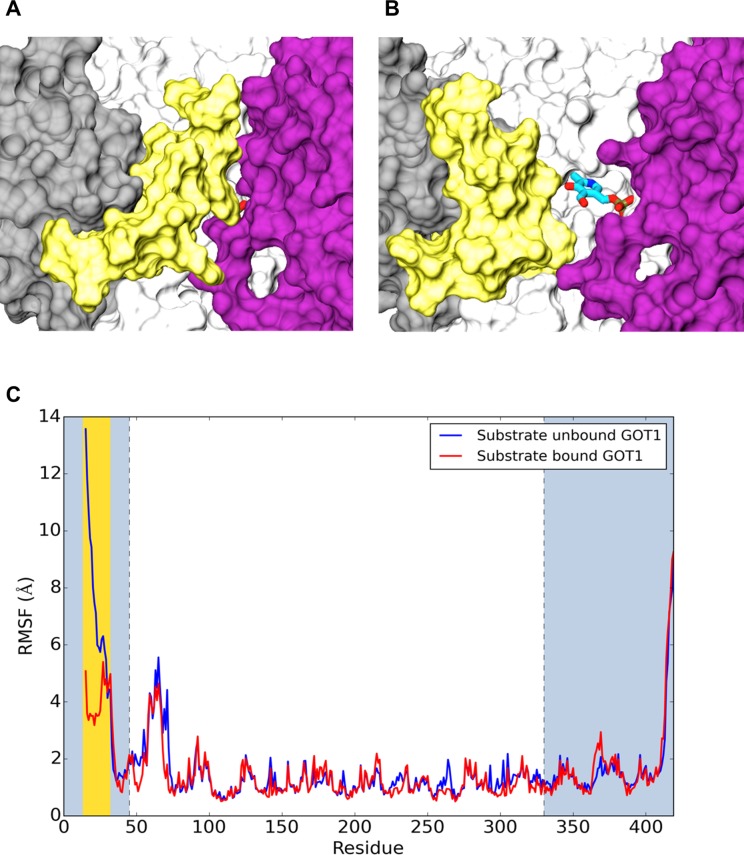
Fig 2.
(A) Closed and (B) open states of hGOT1 produced by 1 μs MD simulation. The cofactor is represented by sticks and colored by atom, and the P15-R32 “door” is shown in yellow. The color scheme of the protein corresponds to Fig 1. (C) RMSF calculations for the substrate bound and unbound simulations of hGOT1. Both monomers A and B were averaged in RMSF analysis. The blue plot represents the simulations of WT without the substrate (unbound form) whereas the red plot describes simulation of the enzyme with substrate bound. The large domain is in white, the small domain is in gray, and the loop residues are highlighted in yellow.

