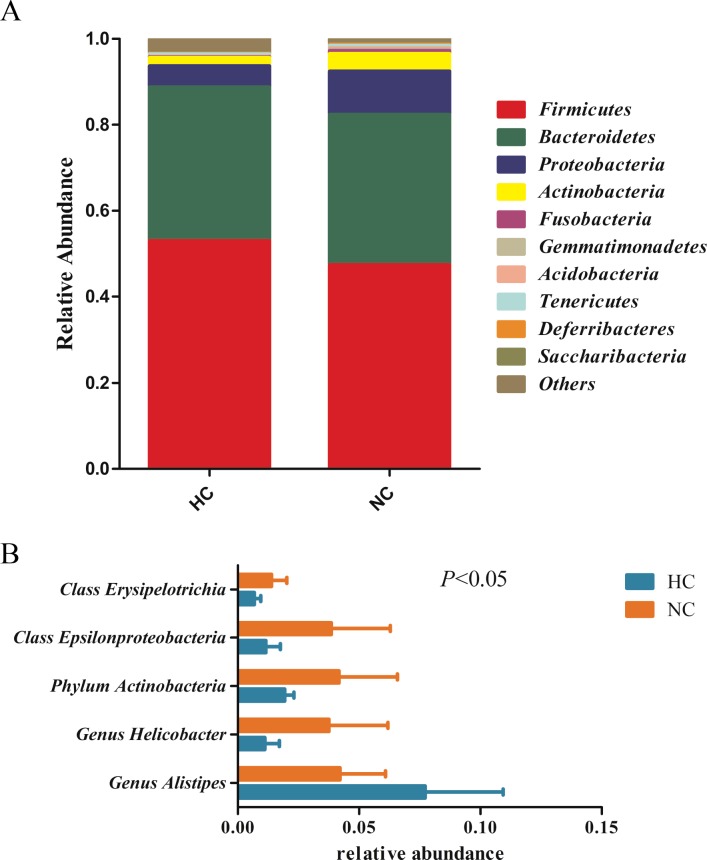
Fig 3.
Relative abundance of bacterial phyla (A) in fecal (Top 10), and statistical significance between two groups at phylum, class and genus levels (B). Phylogenetic groups accounting for unclassified sequences are summarized in the artificial group ‘others’. Statistical differences between two groups were tested using t-test. Differences were considered significant at P < 0.05.

