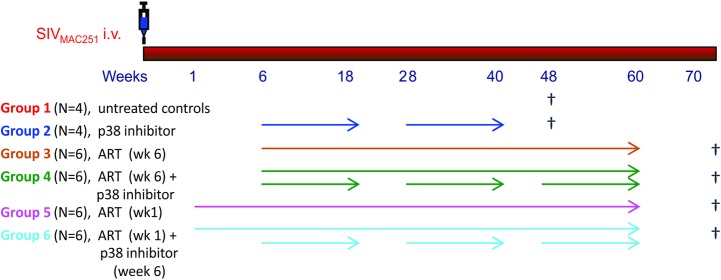
Fig 1. Experimental design.
Group treatments are illustrated and color-coded, with the color used for the group also used in the subsequent figures to identify the data for each individual group. Animals in Groups 1 and 2 were euthanized on week 48, as no significant differences of viremia and immune activation were observed between the two groups during the time course. All treated animals were monitored for 20 weeks after ART interruption.

