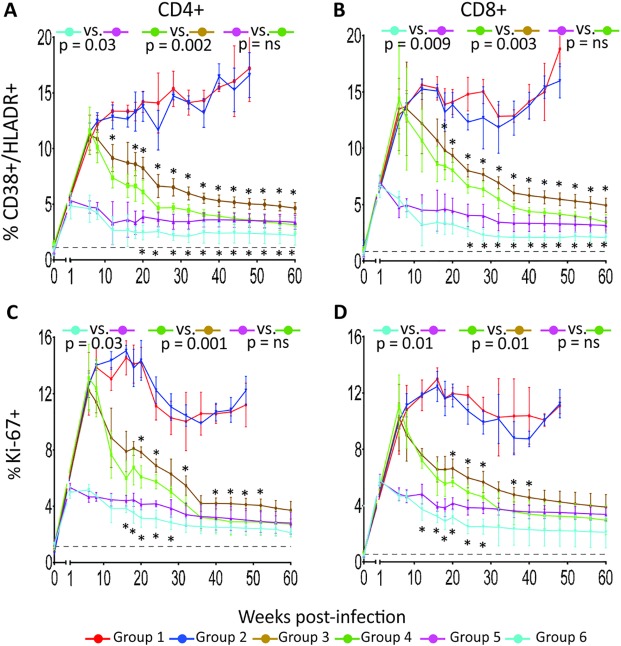
Fig 4. Longitudinal analysis of immune activation marker expression in PBMC T cells of SIV-infected and treated or untreated RMs.
Percentages of HLADR+/CD38+ in CD4+ (A) and CD8+ (B) T cells and of Ki-67+ in CD4+ (C) and CD8+ (D) T cells in PBMC. Data are reported as group average (mean ± SEM) (solid line). The black, dotted line indicates the average of all 32 individual animal values measured before infection. The reported p values were calculated for the comparisons of the AUC from week 8 (first available time point after beginning of PH-797804 treatment) to 60 and refer to AUC comparisons in paired groups. Between groups comparisons at individual time points were carried out with Wilcoxon-Mann-Whitney (rank sum) test. Asterisks mark significant time point paired comparisons for Group 3 vs. Group 4 (asterisks above brown line) or Group 5 vs. Group 6 (asterisks below blue line).

