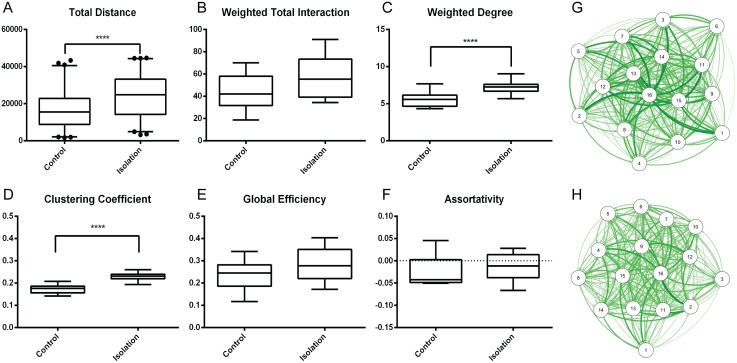
Fig 2. Effects of social isolation on the parameters of average networks.
(A) The Total Walking Distance in the isolated group is significantly higher than in the control group (p<0.0001). (B) No significant difference is found between the Weighted Total Interaction of the control and isolation groups. (C and D) A significant increase of Weighted Degree and Clustering Coefficient was observed between average networks of control and isolation groups (p<0.0001). (E and F) No significant difference was found between the global parameters Global Efficiency and Assortativity of the control and isolation groups. Average networks representing 10 repeats of experiment on control (G) and isolation (H) groups. All plots use 2.5th to 97.5th percentiles as whiskers and 25th to 75th percentiles as box, with the median value in the middle of the box (n = 10).

