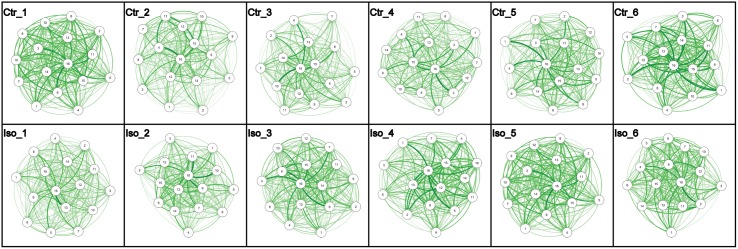
Fig 3. The change of average networks of the control and isolated groups with changing isolation time interval.
Ctr_1 to Ctr_6 are averaged networks from flies in the control group from 1 to 6 days of preparation. Iso_1 to Iso_6 are averaged networks from flies in the isolation group kept in isolation from 1 to 6 days. Each average network is the mean graph of the networks from 10 biological repeats. Nodes represent “average flies” and edges represent the average number of interactions from one “average fly” to another. Isolated flies generally display more interactions than control flies.

