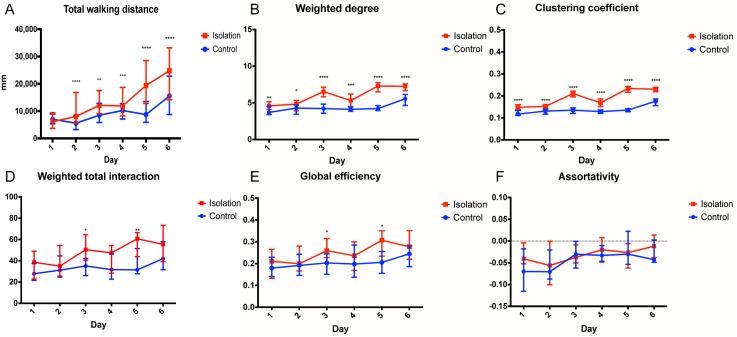
Fig 4. Changes of locomotor activity and social network parameters with changing isolation time interval.
(A) The Total Walking Distance, represented by its median with an interquartile range, shows significant differences between control and isolation groups (p<0.0001) except after 1 day of isolation. Different parameters reveal differences between control (blue) and isolated (red) groups over time. Significance is denoted with asterisks, the number of which represents the negative order of magnitude of the p value. Data are shown as median values with interquartile ranges, with 10 repeats on each isolation day (n = 10). (B) Individual parameter Weighted Degree of control and isolated flies shows a significant difference from day 1 which increases significantly after day 2. (C) Difference in the local parameter Clustering Coefficient also shows from day 1 and increases over 6 days. (D) Global parameter Weighted Total Interaction significantly differs only on day3 and day5 and not on other days. (E) Global parameter Global Efficiency significantly differs on day3 and day5 only. (F) No significant difference was found on the global parameter Assortativity.

