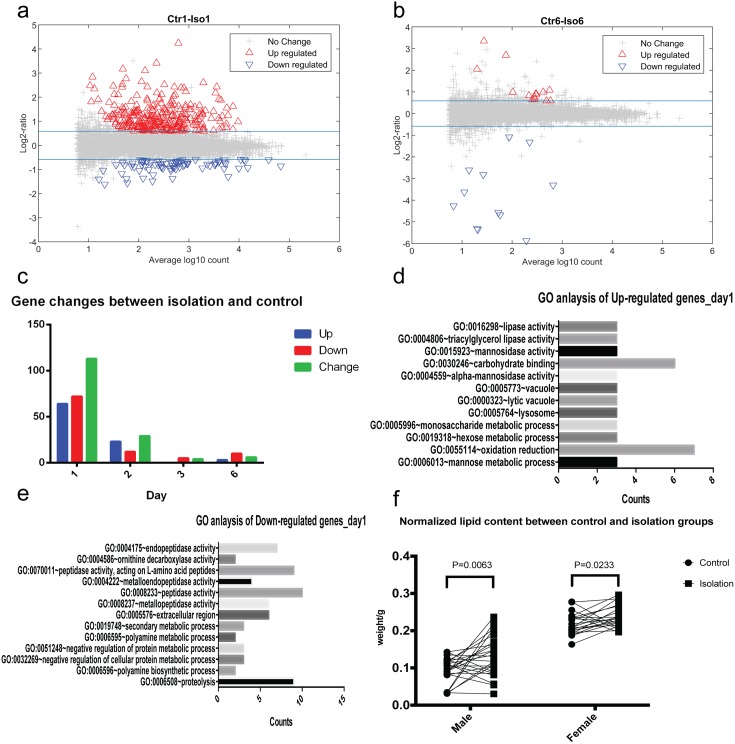
Fig 5. Genome-wide gene analysis of expression and physiological changes.
(A, B) Scatter plots of log2 of fold changes versus log10 of gene counts on day 1 and day 6. Red up triangles show genes whose expression levels are significantly increased more than 1.5 folds. Blue down triangles show genes whose expression levels are significantly decreased more than 1.5 folds. Blue lines show the ±log2 1.5 thresholds. (C) Plot of the number of genes whose expression is upregulated (blue), downregulated (red), or changed either way (green) specifically between isolated and control groups on Days 1, 2, 3 and 6. All experiments were repeated 3 times. (D, E) Gene Ontology analysis of differentially expressed genes on day one. Most changed genes on day one has been clustered into metabolism related categories, in both up- and down-regulated genes. (F) Lipid/dry-weight changes between control and isolation groups in male and female flies. All groups are paired and paired t-test show significant increase in lipid/dry-weight proportion in isolated flies than control male flies (n = 25, P = 0.0063). Isolated female flies also have increased lipid proportion to dry-weight than control flies (n = 22, P = 0.0233).

